

Data captured by our leading Wi-Fi-based spatial intelligence platform enables companies to take advantage of their two greatest resources: people and property. Beginning now in this series of posts, we will explore each powerful metric available through InnerSpace’s technology that business leaders can analyze and leverage to affect meaningful change.
The People Overview
What it is
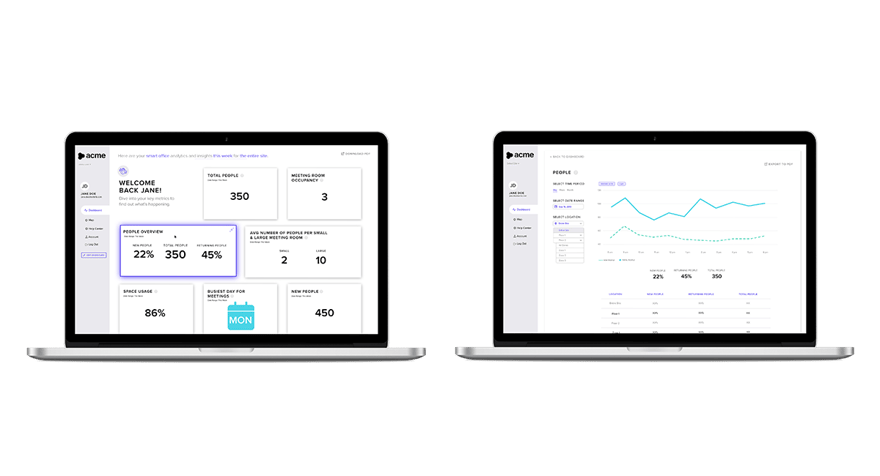
The InnerSpace People Overview in our inTELLO analytics dashboard includes three key metrics:
- The total number of people in the space at any given time.
- The number of people that have been in the space before (repeat visitor).
- The number of people who are new to the space.
The InnerSpace platform is the only platform to combine occupancy data and the industry’s most accurate Wi-Fi location data. We use this combination to provide a total count of people in the space at any time, to understand how many unique people are using the space, and how many people are new to the space. We then break down these metrics across a multi-floor office, on any particular floor, and then specific zones on each floor.
The ability to reveal the two types of people in that space – returning and first-time visitors – is unique to InnerSpace. These are automatically broken down as percentages alongside total people in a space.
Why it matters
The “People Overview” metric enables leaders to measure and understand how the office is being used over time. Being able to analyze these participation levels is of critical importance when companies are returning to work, measuring strategies, testing new designs, and wanting to understand how their space is performing.
These data points reveal if the office is being used as intended. They are also used to understand employee preferences – and from that, leaders can tailor office layouts and strategies to those preferences, which will better support employee productivity and safety. This stems from understanding which zones are most utilized, and where the repeat behaviors occur.
For example, one of our clients created a new collaboration space. By tracking the repeat visitor rate before the new design, and again afterward, the client was able to understand what percentage of people were accessing the space, and whether it was the same people who used it most often. This helped to inform future design and program success.
At a building level, People Overview enables leaders to understand employee population trends and overall guest volume over weeks, months, years. This is a valuable way to validate such important matters as visitor and security counts, and strategies to reduce or eliminate issues such as office tailgating. On each floor, it’s a key way to measure how zones are performing when it comes to their design and accessibility, and whether employees find them attractive places to work.
As companies look to create an office experience that supports employees in an evolving paradigm, key people counts and insights into behaviors are key to successful outcomes.
To learn more about how our platform can work for your specific needs, get in touch anytime.