

Q: How is the reopening plan going on the ground?
During a weekly huddle, the HR team at Company X discussed the company’s move to a hybrid workstyle since reopening two months prior.
Senior leadership had asked for a summary of return-to-office results to-date. Considerable budget had been allocated to an office refresh, so leaders wanted to know how well the new office layout was performing, who was coming into the office and when, and if key spaces were being used as intended.
The HR team knew they could quickly generate an analytics report from InnerSpace’s InTELLO solution that would paint a clear and detailed picture.
Answers found in workplace intelligence
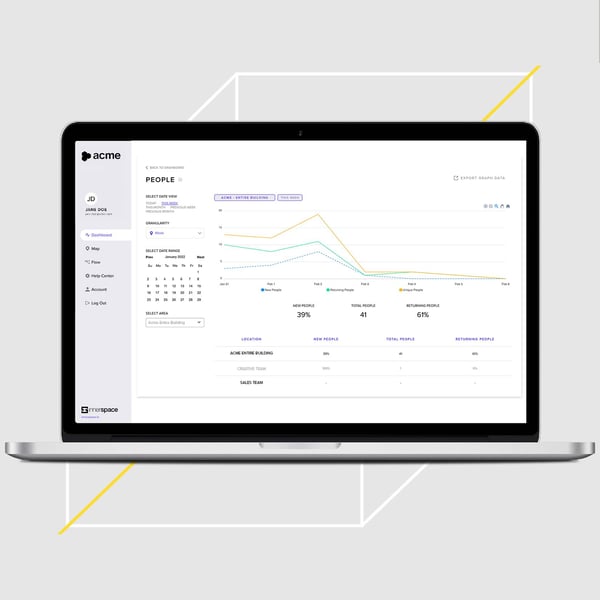
To start, the team analyzed the last four weeks of data captured by inTELLO. They were able to hone in on key metrics that yielded important insights into office occupancy as well as how employees were now using the revamped workspace.
Occupancy data revealed that all of the zones on each floor were performing as intended. In fact, metrics demonstrated that each team’s area was always within eight percent of the target 60 percent occupancy levels on any given weekday.
They also drilled down into team-level data as well – how frequently members of certain teams were in the office, and for what hours of the day. For example, the sales team tended to visit the office less frequently due to client calls and other events, while the admin team was there during consistent hours most days. The finance team, as expected, has continued to work remotely for the most part.
HR also knew that a hot-desking strategy was initially controversial. With InTELLO in place, they could accurately report on how well the shift away from cubicles was going. They did so by parsing how many people were using the desks, how often, and when.
Two months into the new hybrid office, the HR team could confidently report to senior leadership that the spaces were supporting employees as intended, with a functional balance of employees both in the office and at home.
Key metrics uncovered by inTELLO:
+ Total People + New People
+ People Overview
+ Traffic
+ Frequency
Enhanced Data and Visualization Made Simple
The inTELLO analytics portal displays InnerSpace space utilization data as a series of simple cards presenting answers to common questions about space usage. Its at-a-glance nature is augmented with detailed charts and graphs that present the full spectrum of historical data for reference over periods of time.