

This year, we conducted a study for a global company in the employment and careers sector. In order to design their offices for the greatest efficiency, they needed to know how their real estate was being used, and by whom.
Spaces shape human behavior and can be the difference between a good workplace and an extraordinary one. One that doesn’t quite hit the mark and one that people gravitate toward.
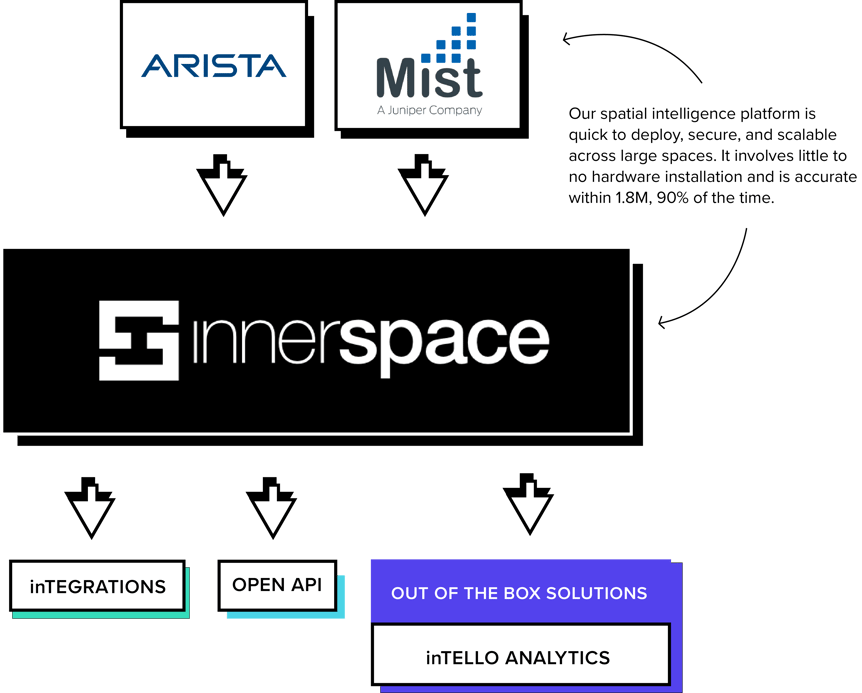
To design that next-level space, it requires data science to be able to analyze and understand the tendencies and, thus, needs of people inside an office. It requires Indoorology – the study of our behavior indoors – which is guided by InnerSpace’s spatial intelligence platform.
Introduction
In the aftermath of COVID, our client was looking to redesign their main corporate hub to suit the needs of employees today and in the future. The problem: they needed first to understand how employees were using the office —now.
They sought quantitative insights into those behaviors in order to redesign their headquarters into one that purposefully meets the needs of their staff. We set up their office with the InnerSpace platform to obtain a clear understanding of how different teams were now using the location post-COVID.
Methodology
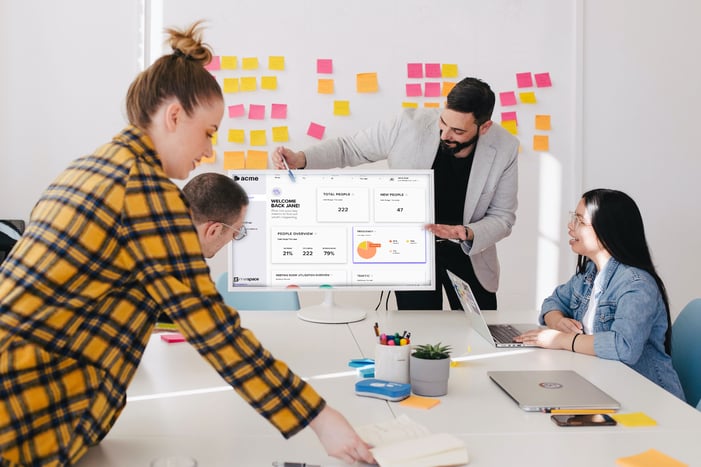
Leveraging the existing Wi-Fi network and using inTELLO, our data visualization and analytics portal, the company was able to pull custom reports that captured such intel as visit frequency data and traffic patterns. This method would provide an answer to where and when employees spend most of their time.
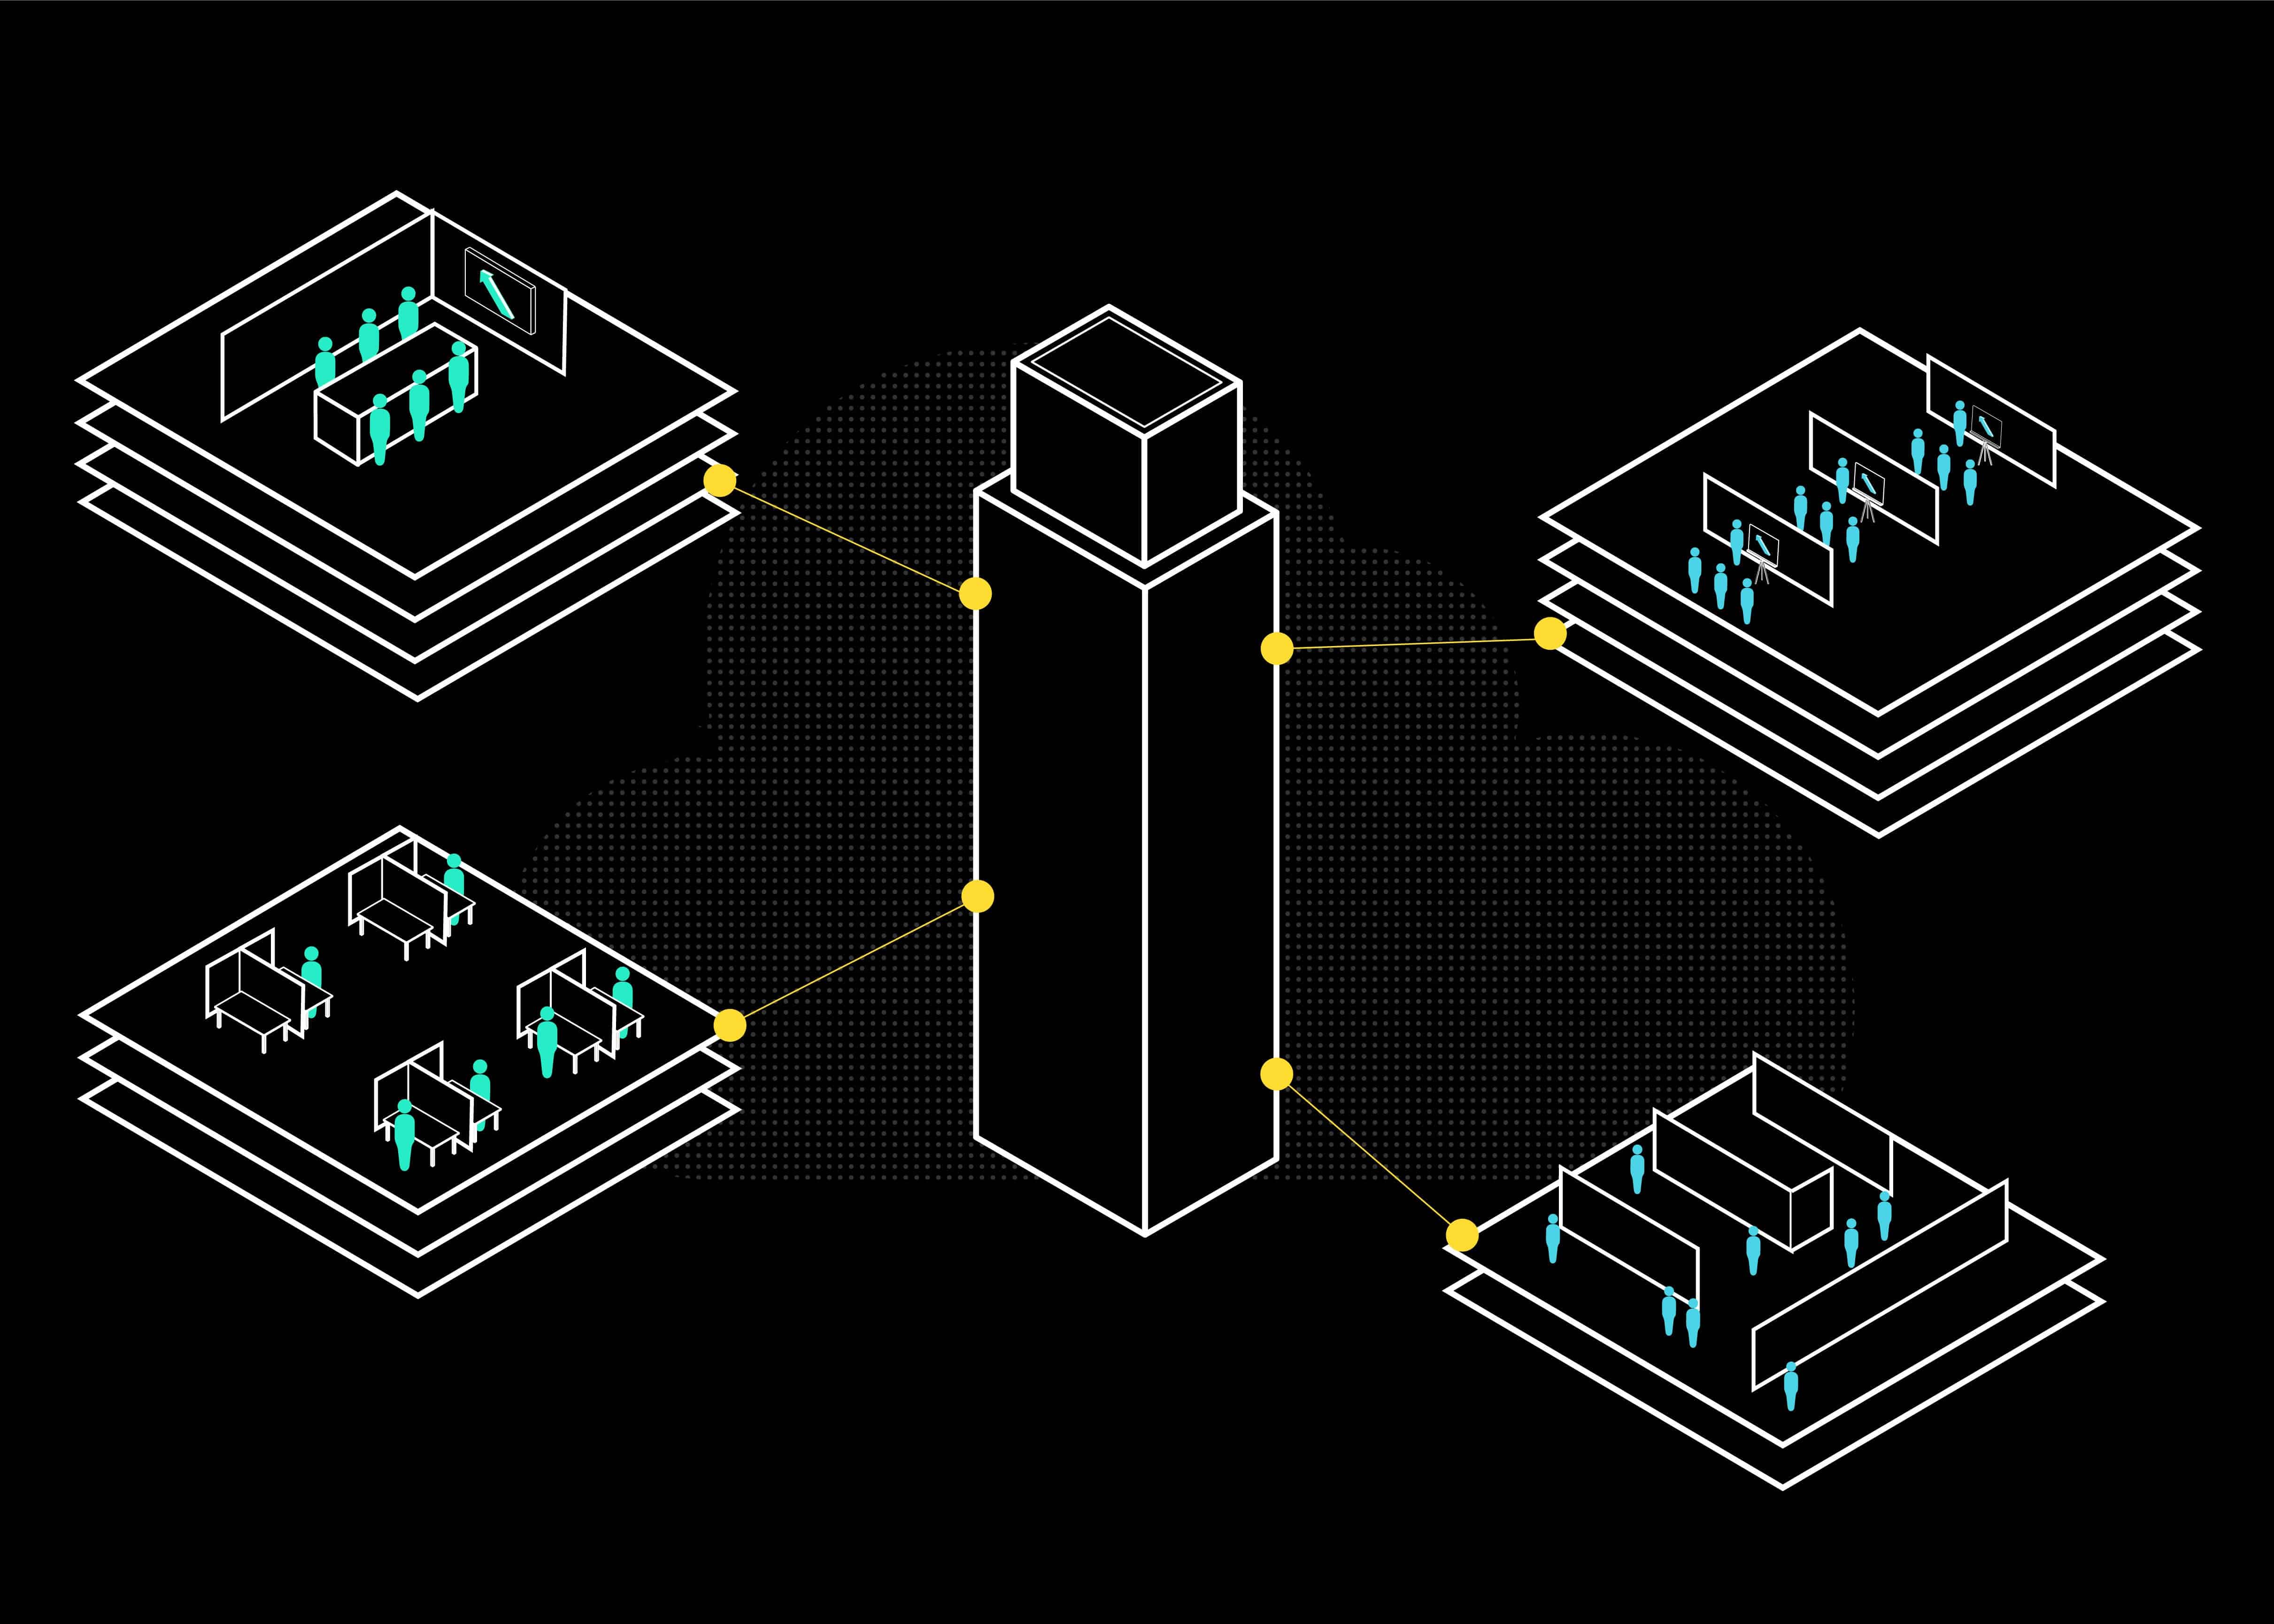
This three-month population study ran from February to April 2022 across 315 office zones. Our technology studied the tendencies of 1,420 people in 34 different teams while respecting personal data privacy.
We grouped the information into four key elements to help tell the story:
-
General Employee Persona: This yields data on how the average employee is seen in the office.
-
Office Traffic: This shows when people arrive in office zones, and occupancy rates for each floor.
-
Team Behaviors: This reveals how different teams have different behaviors in how they use the office space.
-
Space & Zone Type: This filters the data on employee behaviors and filters down to individual office spaces and zones.
Results
The study uncovered specific tendencies and behaviors of employees and teams across the multi-floor office. Essential, valuable insights are categorized here:
General persona
-
Time in office: On average, employees visit the location two days a week for 6 hrs 23 min each. The highest figure was 37% for office visits more than 7 hours. The lowest was 5% for visits less than 2 hrs.
-
People by week: An average of 133 employees are on-site each day – but from February to March the numbers doubled.
-
Building utilization: The office space was used 23% each day compared to the people it could accommodate. The peak day over the study demonstrated 61% of the office space being used.
Office Traffic
-
Busiest periods: Thursday was the busiest day with an avg of 206 people on-site, and the 11th floor the most visited (by 37 people).
-
Quietest periods: Fridays were least busy with an avg of 95 people. Floor 4 is the most active area at 21 people.
Team Behaviors
-
Mobility through office: Our system determined how often each unique team travelled through different office zones for their work and ranked them in order.
-
Interactions within teams: How much time do team members collaborate together when at the office? We found that only two teams spend the majority – over 50% of their time on-site – together. We ranked the most interactive teams in order.
-
Frequency vs mobility: All 34 teams were placed on a data graph regarding how often they worked in-office and how mobile they were.
-
Floor preference: For all 34 teams, we calculated what top 2 floors they most often chose to work.
Space and Zone Type
-
Most efficiently used office zones: Our location data revealed the top 3 zones by capacity, which proved to be an open lounge and two specific conference rooms.
-
Most used zones overall: The client was interested to learn that a key outdoor space was the most used zone overall, and to see which teams tended to take advantage of the space the most.
-
What are spaces being used for: Data showed the top reason to visit a specific location was focus (4.75 hrs/day), followed by collaboration (3.25 hrs/day) and then by the lowest reason, “rejuvenation” (1.75 hrs/day). Broken down further by teams, data showed how certain groups tilted more strongly in certain directions.
-
Moving between zones: We studied the foot traffic flow of people through all 19 zone types by each half-hour to identify the most-travelled zones.
-
Moving inside zones: We also identified the foot traffic flow of people through 19 zone types, highlighting times of the day when people tended to be in certain locations the most.
Conclusion
Through this analysis, our client was able to discern how, where and when their employees preferred to work, influencing future strategic decisions on how to optimize their space. Metrics were captured at every part of the office, from 7 a.m. to 6 p.m.
The leadership team learned many behaviors that they did not know about their workforce before, such as the fact that employees prefer lounges and informal meeting areas. They were also able to determine that conference rooms and open lounges are preferred in mid-morning. And that the most popular meeting times are between 11 a.m. and 2 p.m.
Overall, the key takeaways were:
-
Employees prioritize spaces for unscripted, more impromptu collaboration opportunities.
-
The rate of employees returning to the office spiked during the course of the study, representing a surefire return to the office.
-
Employees show they value a hybrid work model, as they tend to be in-office 2 days a week. When they are on site, most work full days and maximize their time.
-
Resource needs are not one-size-fits-all for every office worker. They vary with workstyles and between those who are more mobile in the office, and those who tend to stay in certain zones.
-
Staff actively used the different space resources, meaning providing areas for collaboration, focus and rejuvenation is individually important.
By using Indoorology, our client can now take a precise approach when fielding requests from various teams around resourcing and desks. They can take action on real estate, reimagining how the existing office can be redesigned, and how the new west coast office should be designed – in both cases, with flexible solutions to suit their staff’s actual needs.