

Build, manage and measure a more efficient, more functional, more strategic working environment without adding to your square footage
Today's business leaders are looking to maximize real estate portfolios to create flexible, versatile, usable space that boosts productivity, serves the needs of returning employees, and enables teams to operate efficiently - within existing square footage.
So while companies debate how to deliver a strong employee experience post-pandemic, how to revamp workspaces to support collaboration and flex work models, and how to achieve maximum health and safety, most are also debating how much space they actually need.
Inside boardrooms across the country, executives are asking the following questions:
-
We need to hire 50 people by Q3 - where will they sit?
-
How can we make our workplace more flexible to serve more people?
-
What do our teams need from the office now?
-
How can we plan for the next five years? 10 years?
-
Where can we make the biggest, most cost-effective impact to the office?
-
How can your real estate best serve employee experience, helping the team be productive whether working together or apart?
-
What options are actually available to us right now?
It doesn’t have to be murky.
The way forward is to redesign offices to maximize real estate to support company culture, set employees up for success, and make optimal use of all space that you already pay for.
OPTIMIZE OFFICE WITH SPATIAL LOCATION INTELLIGENCE DATA
While expanding or reducing your real estate footprint may seem like the only way forward to impart real change, this is no time for best guesses. When it comes to office buildings, mistakes can be expensive. And, if not executed well, a dramatic change or lengthy disruption to the working environment can impact an employee’s productivity - and their desire to be in the workplace overall.
The key to maximizing the current real estate footprint is to understand how it is being used. To understand the tendencies and preferences of your employees. To go beyond theory or assumptions, and get the straight goods.
The easiest, fastest and most reliable way to gain these answers is to collect data and then read what it’s saying. We are talking here about spatial location intelligence data that provides analytics around how employees behave in a space. Imagine knowing not just how many people were on the fourth floor yesterday or last week but instead have insights into their behavior?
Answers to questions like:
-
Who, exactly, was there?
-
How did they get there?
-
How long did they stay?
-
Where did they go next?
-
How often do they return?
These people analytics reveal how employees actually use an office, identifying trends that provide a rich tapestry to design the office, assign resources, choose the best leasing strategies, inform policies, create new services for staff, and, eventually, rationalize the overall portfolio.
Accessing such insights is more straightforward than you might think. The infrastructure to collect and access them is already in your space.
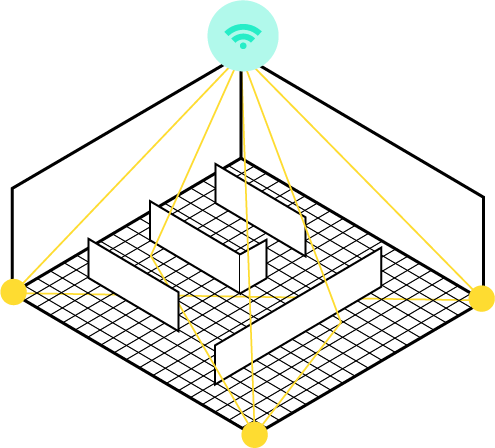
HOW TO LEVERAGE YOUR WIFI TO IMPROVE YOUR OFFICE’S PERFORMANCE
These analytics are already within reach, because all you need is WiFi.
We know WiFi for Internet access, but as it has evolved over time, it has became a highly effective option for location-based spatial location intelligence technologies. WiFI is omnipresent, easily accessible, and affordable – and with each passing year, it becomes faster, more reliable, more secure, and more accurate.
WiFi is the best case scenario for corporate offices to implement accurate, scalable indoor location tech solutions. For companies, the larger the real estate portfolio, the faster and more affordable WiFi solutions become. With minimal, if any, hardware involved, companies can get more data at far lower costs.
Most importantly, the insights are accurate. WiFi location data is unbiased, reflecting the true picture of what’s happening in each office, floor, zone, or conference room.
Here are a couple of great examples of how data can come alive with visualizations that can truly inform how to make the most out of your total square footage.
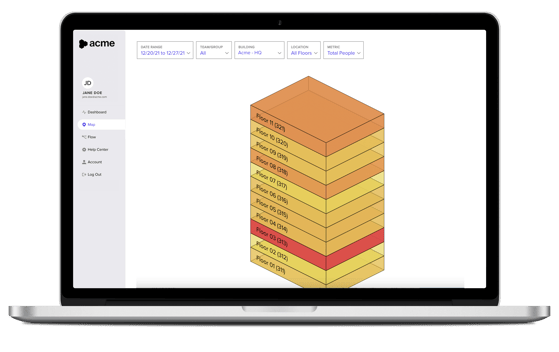
Heat maps, which reveal how people move through a building, are among the most popular tools used by InnerSpace clients. They use them to see every floor of an office to pinpoint the areas where people gather, cluster, spread out or avoid altogether. You can rank zones by their percentage of utilization – low areas are clearly ripe for redesign. High areas could be duplicated, for instance, on other floors. The best part is that you can view metrics broken down by teams (e.g. legal, HR, marketing, etc) or by time of day.
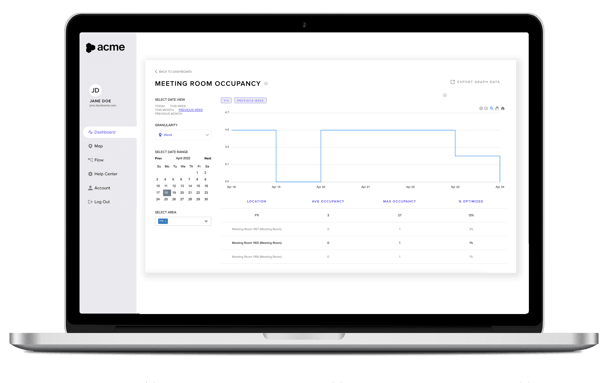
Meeting room analytics are another key area of interest, as these resources take up plenty of real estate and risk sitting empty quite a bit. With spatial location intelligence data, you can identify patterns and trends on their use in order to then redesign them to meet actual employee needs. Metrics include new and returning visitors, average occupancy and length of meeting and average time unoccupied per week.
 (Say the meeting spaces on floor X are frequently booked solid. You could embark on expanding the workspace and create more meeting rooms. Or you could learn more about the existing rooms: WiFi solutions can quickly determine that the problem is not a shortage of meeting rooms on that entire floor, but instead a shortage on a different floor, and people are travelling elsewhere because of that fact.)
These are the sorts of insights derived from WiFi-based solutions, rather than more basic occupancy sensors alone. They can integrate with existing sensors or operate with none at all, which can cut costs and get the solution up and running in less time – ideal when a company is trying to rationalize real estate sooner rather than later.

SPATIAL LOCATION INTELLIGENCE REVEALS ACTIONABLE INSIGHTS: A CASE STUDY
A global leader in lodging and hospitality installed the InnerSpace platform in their main office. The goal was to understand the behavior patterns of two distinct teams of employees in a space. The client wanted to design the space efficiently, putting resources where they were needed most.
To do so, they needed data to understand the true needs of their teams. To that end, using the WiFi signals of each person’s smart devices (maintaining full individual privacy), we helped this client identify key workplace behaviors and patterns of movement – and, as a result, inform office design, resourcing and seating assignments.
In this study, we were able to track individual time in-office, in team zones, in meetings, off the floor, and when employees arrived and left. While teams may seem homogenous, the data revealed that there are “teams within teams” that emerge when it comes to key behavior insights.
Interesting and informative highlights include the following:
Legal team:
-
Most days, on average, their space is 55 percent full. And it never exceeds 75 percent.
-
They spend an average of 4 hours at their desks.
-
They leave their neighborhood for over one-third of the day.
-
Those in office 1-2 days a week arrive 30 minutes earlier than others and spend 90 minutes more at their desks.
-
Those in the office 3-5 days a week spend less time at their work stations and more time in collaborative spaces and off the floor than others.
-
They spend an average of 27 hours in meetings/day – 15 percent of the available conference room times on the floor.
-
Three distinct groups emerged with different habits on when and where they tended to work: those whose office visits are usually <4 hours, 4-8 hours, and >8 hours.
-
Members who visit the office most frequently also have longer days.

Recruitment team:
-
Most days, their space is 50 percent full. It can and does, sometimes, reach 92 percent capacity.
-
They spend an average of 3 hours at their desks.
-
They leave their neighborhood for over one-third of the day.
-
Those in office 1-2 days a week have shorter visits (by 2 hours) and spend half their day in meetings.
-
Those in office 3-5 days a week have nearly 50 percent longer visits than their more remote colleagues, spending more time in collaborative spaces and off the floor.
-
They spend an average of 12 hours in meetings/day – 7 percent of the available conference room times on the floor.
-
Only 12 percent use the team’s assigned project room.
-
Those same three distinct groups emerged with different habits: <4 hours, 4-8 hours, and >8 hours typical office visits.
-
Members who visit the office most frequently also have longer days.
Key lessons from the data
The company deciphered several key lessons. For instance, these employees are already quite mobile, working offsite two days a week, spending less than half their time in designated desks. Employee:desk ratios were sub-standard, meaning the company could cut down assigned areas and build more touch down areas for overflow.
This particular finding made it possible to allocate 100 new hires within the existing square footage, removing the need to expand floor space - saving the company approximately $1.2 million in future expansion costs.
And while resources were well-aligned overall, on a more micro level, needs vary with workstyles – both team to team and within teams.
In the company’s hybrid work model, it was essential to continue to adapt the office space as needed. To do this, they realized that collaborative space must increase, with room versatility a priority.

A FOUNDATION BUILT ON QUANTITATIVE BEHAVIOR INSIGHTS
Companies can potentially save millions of dollars by analyzing and optimizing how their current spaces are used before acquiring – or even selling – real estate.
Analytics that go beyond people counting alone can provide valuable intel that combine occupancy with density and intel about time on site, frequency on site, utilization of the site – and how all of this varies between and within each team or department.
Only with this approach can you get practical insights about common space, desks, meeting rooms, hallways, lounges, lighting, schedules, and the full real estate footprint.