

Arun is part of the legal team for a multinational company. He spends three days a week at head office for about seven hours a day, with Tuesdays and Thursdays being key for in-person meetings. He’s typically onsite just before 10 a.m., leaving by 5 p.m.
Arun’s colleague Stella is a member of the recruitment team, working in another part of the office. She too spends about three days a week in the office, but her most important days for in-person work are Mondays and Thursdays. She too works about seven hours a day, but generally from 11 a.m. - 6 p.m.
For companies who are prioritizing hybrid workstyles, it can be challenging to figure out how people actually use spaces within offices.
In this case, it appears that both Stella and Arun (fictional employees) are at their desks for seven hours a day, two days a week. But is that actually the case? We don’t know how else they may be using the space, what resources they need, and if their other team members have different work styles. Fortunately, there’s a way to find out.
Spatial intelligence reveals unique insights
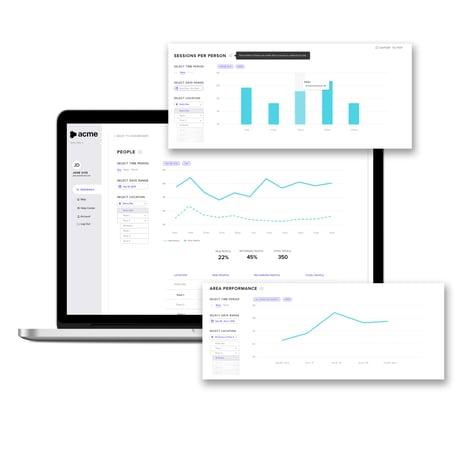
In one particular study, our teams installed the InnerSpace platform in the main office of a global leader in lodging and hospitality. The goal was to understand the behavior patterns of two distinct teams of employees in a space. The client wanted to design the space efficiently, putting resources where they were needed most.
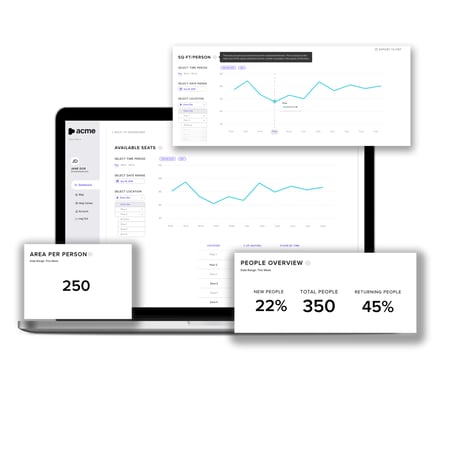
To do so, they needed data to understand the true needs of their teams. To that end, using the WiFi signals of each person’s smart devices (maintaining full individual privacy), we helped this client identify key workplace behaviors and patterns of movement – and, as a result, inform office design, resourcing and seating assignments.
Importantly, this was not just occupancy data – which is essentially people counting in any one floor, zone, or room. That more baseline information can’t reliably help companies build, manage and measure hybrid workspaces.
Here, the InnerSpace platform answers deeper questions, such as: When do these employees come – and how often? Where do they work and migrate? These insights reveal true behaviors and the different needs and patterns of different teams – to help companies make spaces within their spaces as well-suited as possible to each department.
What the data showed
In this study, we were able to track individual time in-office, in team zones, in meetings, off the floor, and when employees arrived and left. While teams may seem homogenous, the data revealed that there are “teams within teams” that emerge when it comes to key behavior insights. Interesting and informative highlights include the following for Stella and Arun’s teams.

Legal team:
- Most days, on average, their space is 55 percent full. And it never exceeds 75 percent.
- They spend an average of 4 hours at their desks.
- They leave their neighborhood for over one-third of the day.
- Those in office 1-2 days a week arrive 30 minutes earlier than others and spend 90 minutes more at their desks.
- Those in the office 3-5 days a week spend less time at their work stations and more time in collaborative spaces and off the floor than others.
- They spend an average of 27 hours in meetings/day – 15 percent of the available conference room times on the floor.
- Three distinct groups emerged with different habits on when and where they tended to work: those whose office visits are usually <4 hours, 4-8 hours, and >8 hours.
- Members who visit the office most frequently also have longer days.

Recruitment team:
- Most days, their space is 50 percent full. It can and does, sometimes, reach 92 percent capacity.
- They spend an average of 3 hours at their desks.
- They leave their neighborhood for over one-third of the day.
- Those in office 1-2 days a week have shorter visits (by 2 hours) and spend half their day in meetings.
- Those in office 3-5 days a week have nearly 50 percent longer visits than their more remote colleagues, spending more time in collaborative spaces and off the floor.
- They spend an average of 12 hours in meetings/day – 7 percent of the available conference room times on the floor.
- Only 12 percent use the team’s assigned project room.
- Those same three distinct groups emerged with different habits: <4 hours, 4-8 hours, and >8 hours typical office visits.
- Members who visit the office most frequently also have longer days.
Mapping the way forward
From what the data reveal, this global company can decipher key lessons in their head office. For instance, these employees are already quite mobile, working offsite two days a week, spending less than half their time in designated desks. As a result, they are well-positioned to begin a full hybrid shift. Employee:desk ratios were sub-standard, meaning the company could cut down assigned areas and build more touch down areas for overflow. And while resources were well-aligned overall, on a more micro level, resource needs vary with workstyles – both team to team and within teams.
In a hybrid work model, it is essential to keep tabs on employee behaviors and continue to adapt the office space as needed. To do this, collaborative space must increase and office designs be as flexible as possible, with room versatility a priority. To both chart course now and tweak direction over time, WiFi-based space utilization data can paint a clear picture.