

Where do employees go and how can we serve them better?
Companies have been evaluating their real estate footprint as workplaces accommodate hybrid workers. Real estate expansion is increasingly adopting a human-centered approach that prioritizes the needs of employees.
Senior management at Company X notified their managers that plans had been approved for a new office location in San Diego. Using data from their Austin location, the team wanted to understand how COVID-19 changed in-office employee behavior and where key office amenities should be located.
Expanding efficiently required tailored, quantitative insights into the client’s operational framework, as senior management prepared to design a new location structured around employee behaviors and preferences.
Answers found in Workplace intelligence
To start, the team turned to InnerSpace location technology to get a high-level overview of patterns and changes in occupancy since their return to the office. Leveraging the Wi-Fi network already in place and using our data visualization and analytics portal, they were able to tap visit frequency data and traffic patterns to determine where and when employees spend most of their time.
The team was also able to access heat maps to prepare a graph detailing the Austin office’s performance per floor.
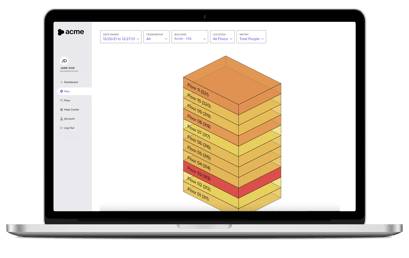
Analytics revealed that floors three and 11 were the most high-traffic regions. On the 11th floor, the patio was found to be popular with employees, many of whom had grown accustomed to accessing outdoor spaces in their home offices. This analysis revealed the need for senior management to consider the importance of outdoor space when planning for their office expansion in San Diego.
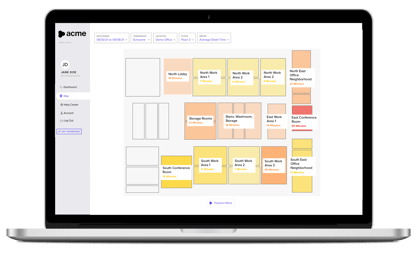
InnerSpace's flow feature also gave the team an indication of where employees traveled throughout the work week. Because the InnerSpace platform can assess movement and flow pathways within indoor office spaces, this adds important – and unique – behavior insights that go beyond occupancy data alone.
After learning that the third floor was the highest-traffic location in Austin, the team used the flow feature to compare movement here to a floor with considerably less traffic. Senior management used these insights to consider where amenities and zones should be located relative to the work area.
Through indoor spatial analytics, the San Diego location was data-driven in its design and better suited to the predicted needs of employees.
Enhanced Data and Visualization Made Simple
The analytics portal displays InnerSpace space utilization data as a series of simple cards presenting answers to common questions about space usage. Its at-a-glance nature is augmented with detailed charts and graphs that present the full spectrum of historical data for reference over periods of time. Use it to optimize your office real estate portfolio